The Home page is the main dashboard you see after logging into SATHI. It shows real-time metrics for your affiliate program, including traffic, orders, revenue, and ambassador performance, without requiring you to open individual reports. Use it to check overall program health at any point during the day.
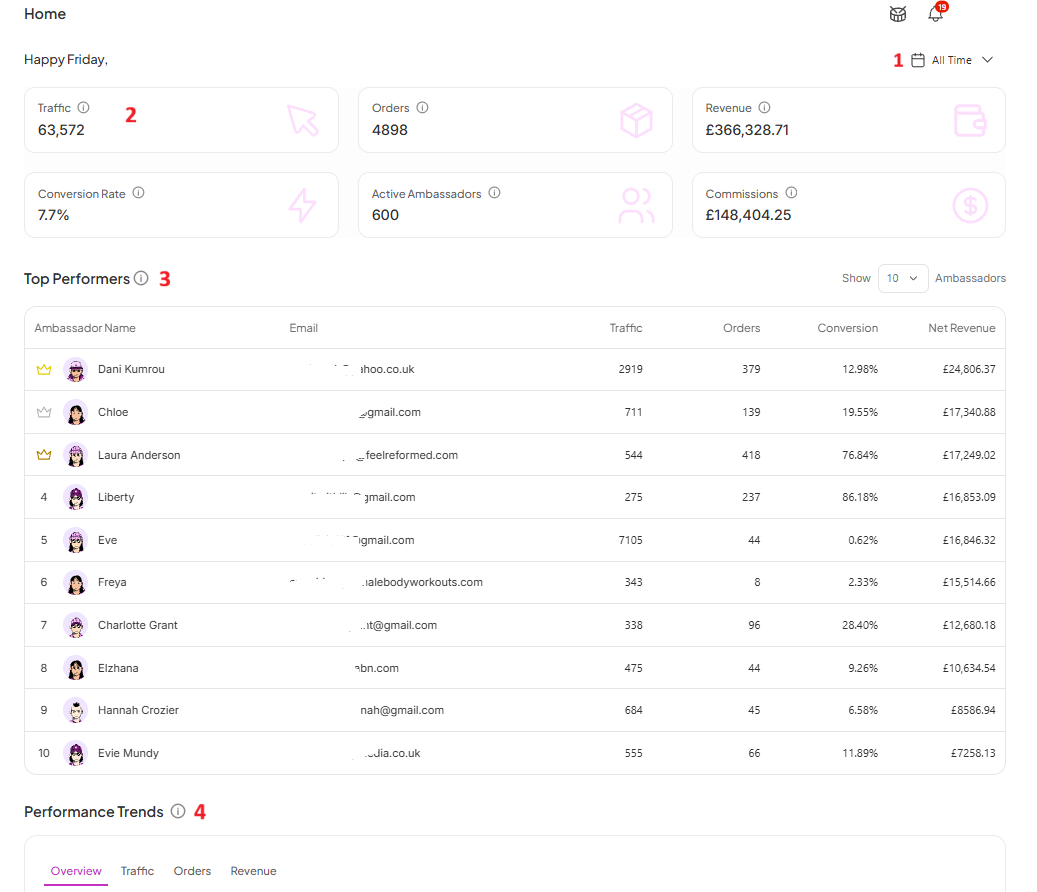
A date range selector sits in the top-right corner of the page, set to All Time by default. Every metric and chart on the page updates based on the range you select, so you can narrow the view to a specific week, month, or campaign period.
Six key numbers appear at the top of the page:
Traffic: Total visits driven to your store through affiliate links
Orders: Total orders attributed to your ambassadors
Revenue: Total revenue generated through your affiliate program
Conversion Rate: Percentage of affiliate-driven visitors who completed a purchase
Active Ambassadors: Number of ambassadors currently active in your program
Commissions: Total commissions paid or owed to your ambassadors

Below the metrics, SATHI lists your best-performing ambassadors, ranked by Net Revenue. The table shows each ambassador's traffic, orders, conversion rate, and net revenue side by side, so you can compare who is driving results versus who is only sending clicks.
You can control how many ambassadors appear using the Show dropdown in the top-right of this section.
The Performance Trends chart shows how your program has changed over time. You can switch between four views:
Overview: Traffic, Orders, and Revenue plotted together
Traffic: Visitor trends over time
Orders: Order volume over time
Revenue: Revenue trends over time
The Home page consolidates data that would otherwise require checking multiple reports. It gives you one place to confirm your affiliate program is performing as expected, catch drops in traffic or conversion early, and see which ambassadors are contributing the most revenue, all without leaving the dashboard.
Still need help?
Reach out anytime to our Support team using the button at the bottom-right corner of your dashboard, or email us at [email protected].

