Core Analytics is the first tab under Performance in the left sidebar. It breaks down your program's results across KPIs, revenue sources, campaign performance, and application data, all filterable by date range using the dropdown in the top-right corner.
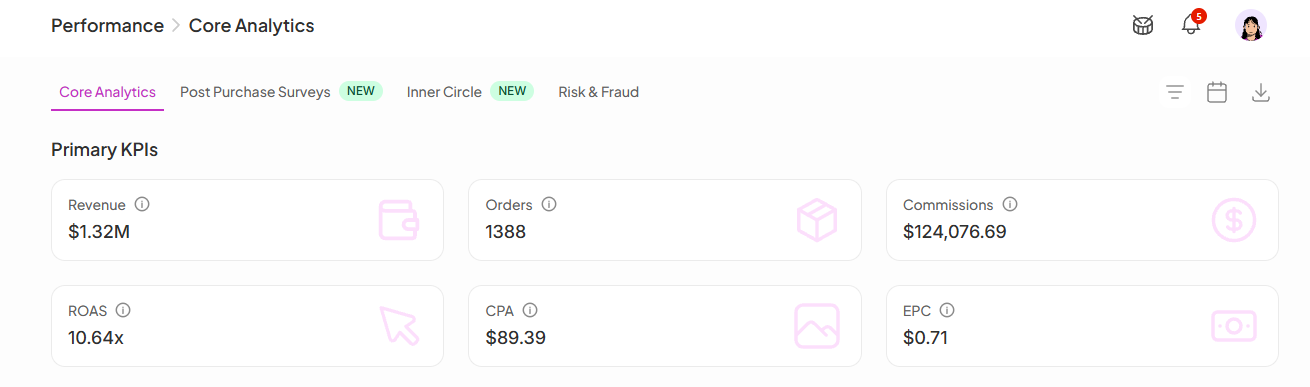
These six metrics give you a quick read on how your program is performing financially:
Revenue: Total revenue generated through your ambassador program
Orders: Total number of orders attributed to ambassadors
Commissions: Total commissions paid or owed across your program
ROI: Return on investment; how much revenue you're generating for every dollar spent on commissions (e.g. 3.01x means $3.01 back for every $1 paid out)
EPC (Earnings Per Click): Average revenue generated per click on an ambassador link, a useful signal for link quality and audience fit
CPA (Cost Per Acquisition): Average commission cost per order, helping you understand what you're paying to acquire each customer through ambassadors
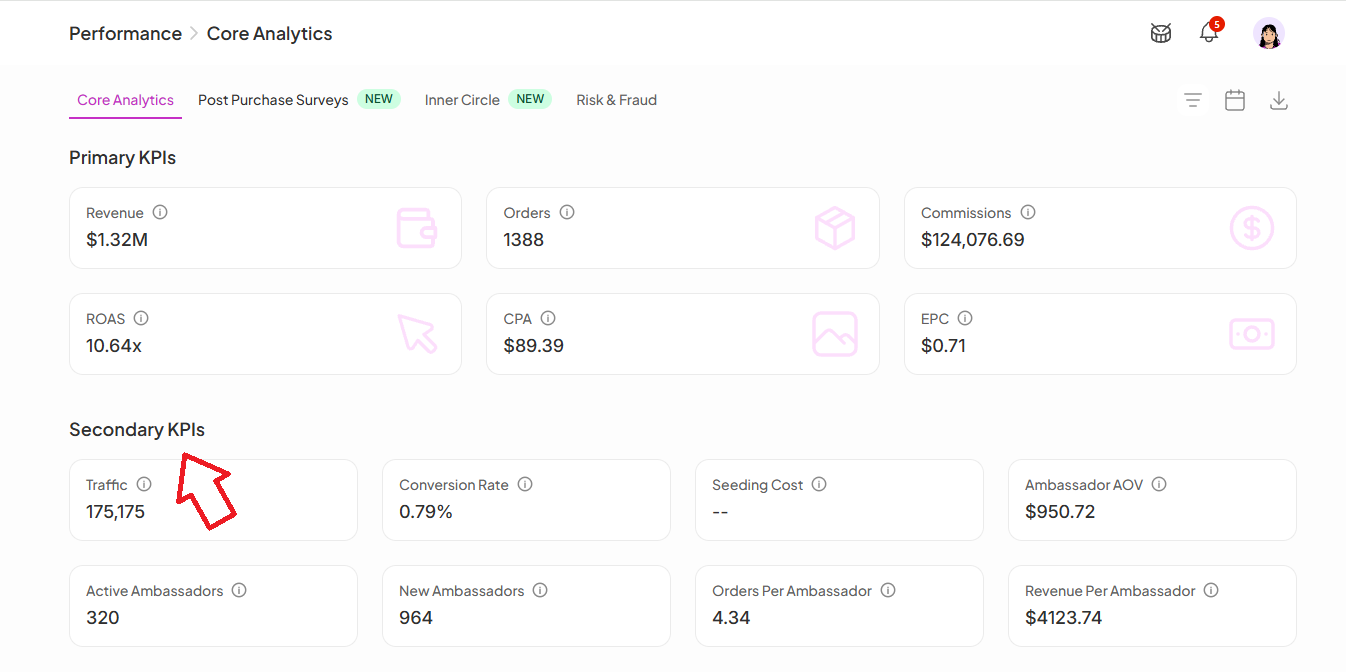
A supporting set of metrics that give more context behind the primary numbers:
Traffic: Total visits driven to your store through ambassador links
Conversion Rate: Percentage of ambassador-driven visitors who completed a purchase
Ambassador AOV (Average Order Value): Average value of orders placed through ambassador links
Active Ambassadors: Number of ambassadors who have driven at least one result in the selected period
New Ambassadors: Total ambassadors who joined during the selected period
Orders Per Ambassador: Average number of orders each ambassador is driving
Revenue Per Ambassador: Average revenue generated per ambassador
Posted Ambassadors: Number of ambassadors who have submitted at least one post in the selected period
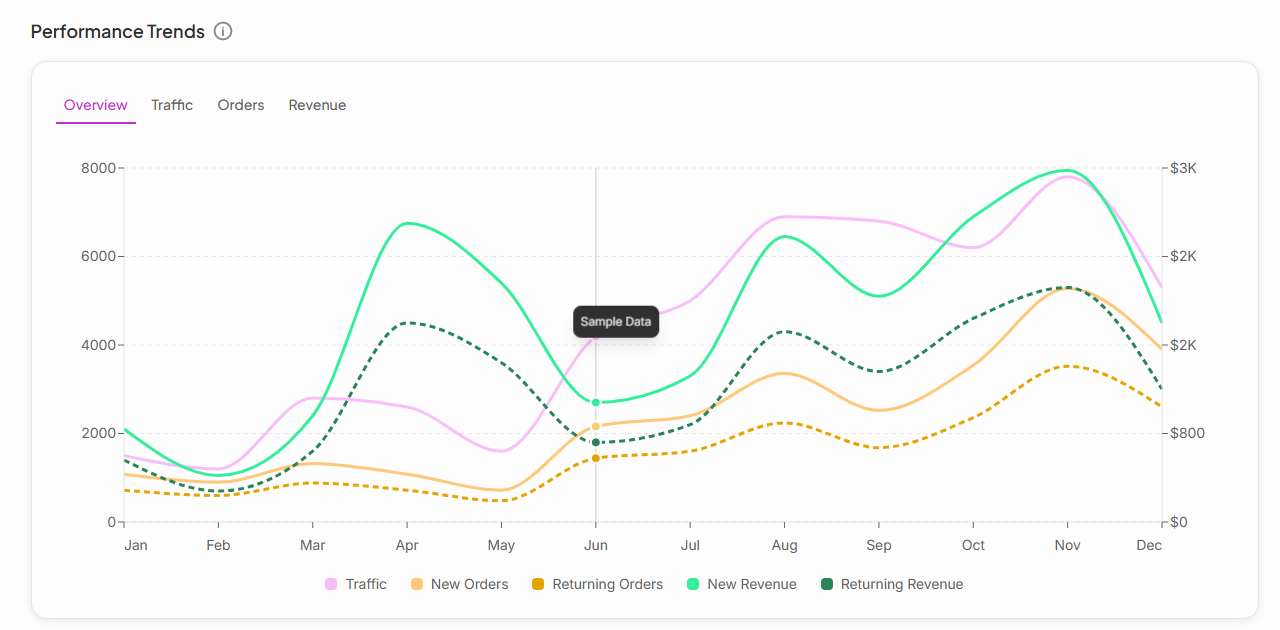
A chart showing how Traffic, Orders, and Revenue have moved over time. Switch between Overview, Traffic, Orders, and Revenue tabs to isolate the metric you want to track. Use this to spot campaign-driven spikes, identify slow periods, and track overall program momentum.
A breakdown of where your revenue is coming from across three ambassador sources:
Recruited Ambassadors: Directly invited or onboarded into your program
Inner Circle: Customers who became ambassadors through your Inner Circle flow
TTS: Revenue attributed through TikTok Shop Partners
This view helps you understand which acquisition channel is doing the most work for your program.
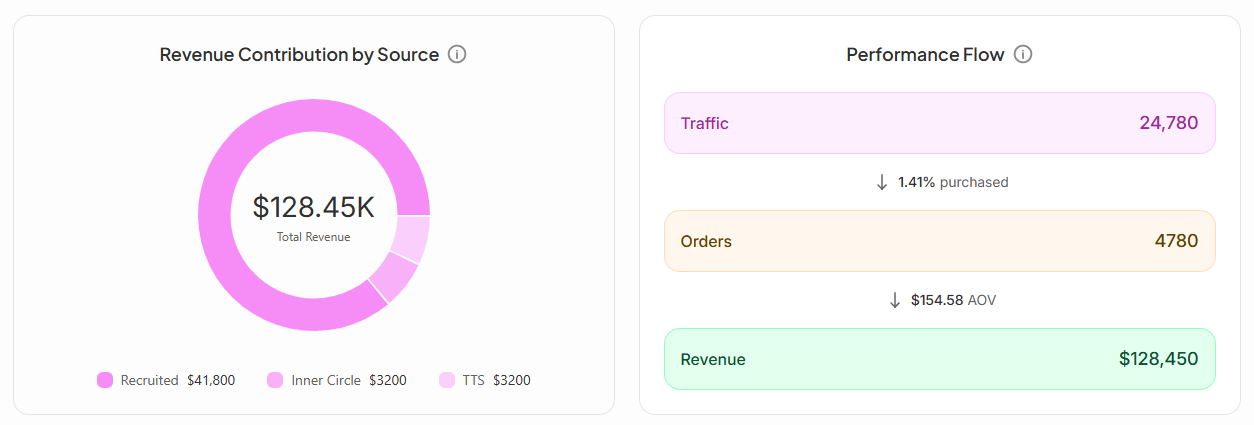
A funnel view showing how ambassador traffic converts into revenue. Use this to see where drop-off is happening and identify which lever would have the biggest impact: more traffic, better conversion, or higher order values.
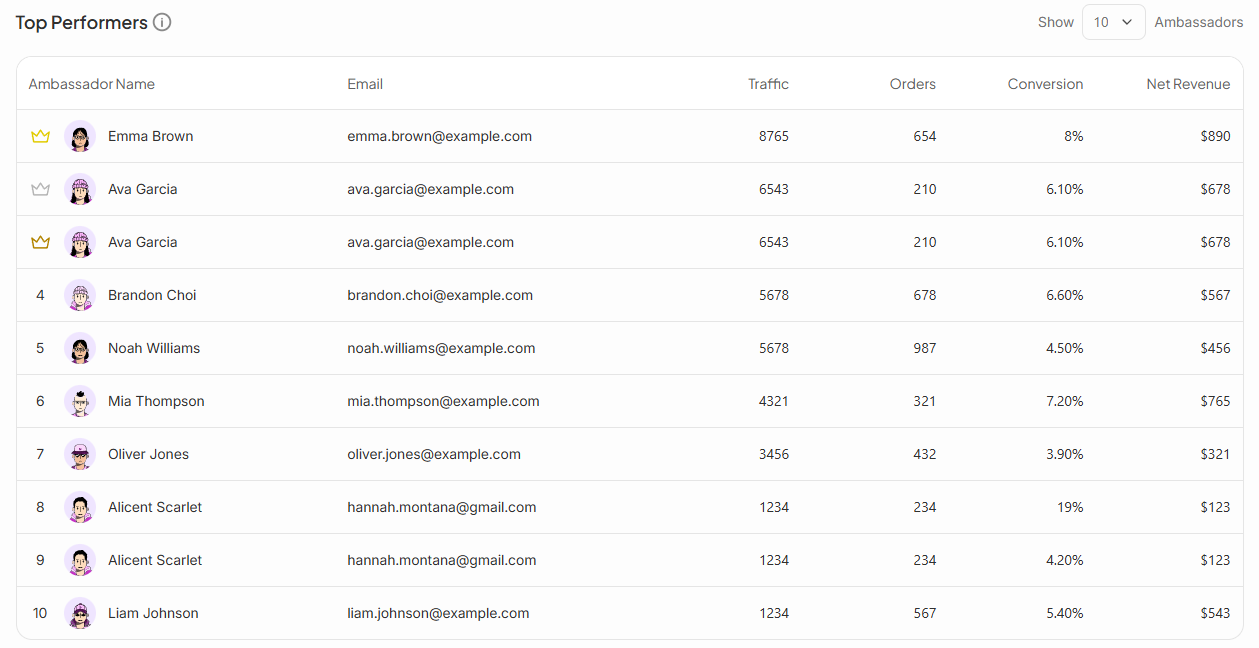
A ranked table of your highest-earning ambassadors showing Traffic, Orders, Conversion Rate, and Net Revenue side by side. Use the Show dropdown to adjust how many ambassadors are displayed.
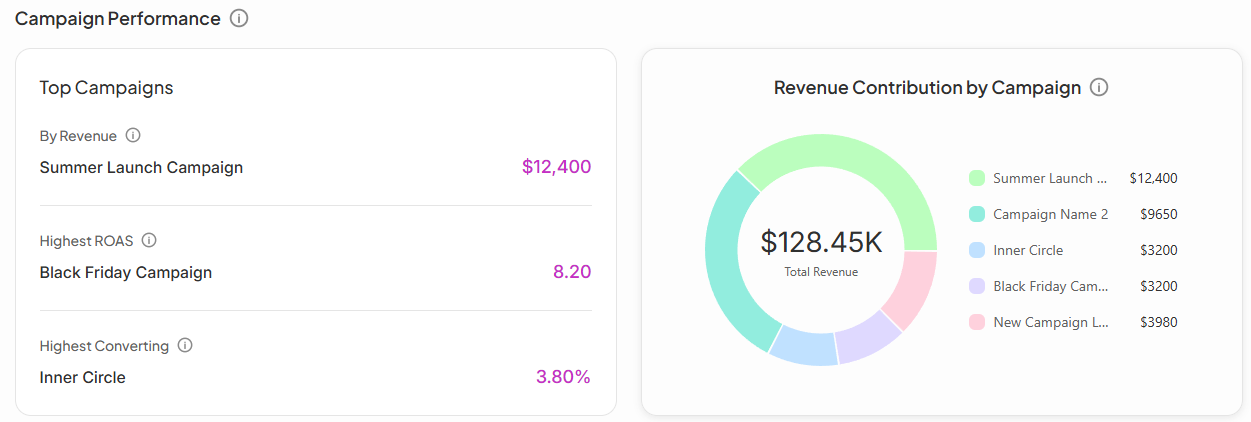
This section shows which of your campaigns are driving the most results. SATHI highlights three standouts:
By Revenue: The campaign generating the most total revenue
Highest ROI: The campaign returning the most revenue per dollar spent on commissions
Highest Converting: The campaign with the best visitor-to-order conversion rate
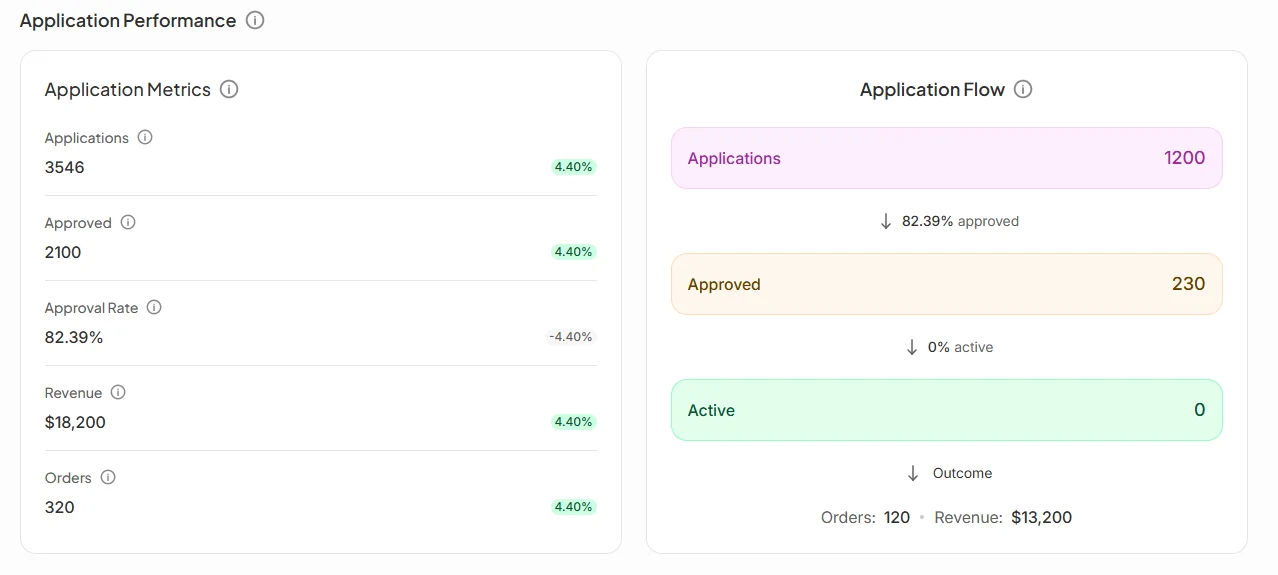
This section tracks how well your ambassador application flow is working.
Application Metrics shows:

Applications: Total number of people who applied to join your program
Approved: How many were approved
Approval Rate: The percentage of applicants you approved
Revenue and Orders: Results generated by ambassadors who came through the application flow
Application Flow visualizes the funnel from application to approval to active ambassador, so you can see exactly where potential ambassadors are dropping off before they ever make a sale.
Applications Over Time is a chart showing application volume trends, useful for measuring the impact of recruitment pushes or public-facing program promotions.
Revenue and order counts alone don't tell you where a program's strengths or weak points are. Breaking performance down by KPI, source, campaign, and application funnel lets you pinpoint exactly what's driving results, whether it's a specific campaign, a strong recruitment channel, or a conversion bottleneck, so you know where to focus your time instead of guessing.
Still need help?
Reach out anytime to our Support team using the button at the bottom-right corner of your dashboard, or email us at [email protected].

