A closer look at three tabs inside the Performance section.
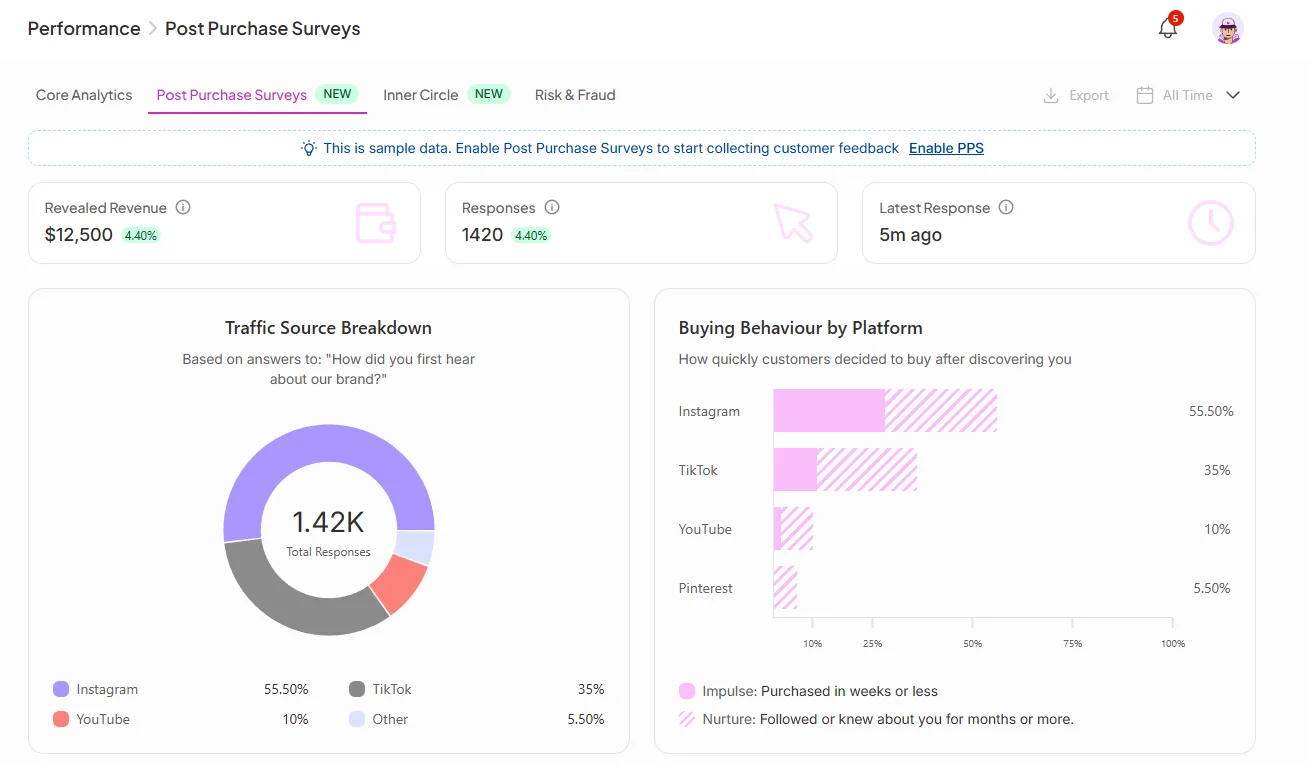
Post Purchase Surveys capture attribution data directly from your customers, asking them how they discovered your brand right after they complete a purchase. This fills in the gaps that cookies and tracking links miss.
To start collecting data, click Enable PPS in the banner at the top of the tab (if you haven't already enabled it).
Key metrics:
Revealed Revenue: Revenue attributed to ambassadors through survey responses
Responses: Total number of survey responses collected
Latest Response: How recently a customer completed the survey
Traffic Source Breakdown shows which platforms customers say they discovered you on (Instagram, TikTok, YouTube, etc.), based on their survey answers.
Buying Behavior by Platform breaks down whether customers on each platform were impulse buyers (purchased within weeks of discovering you) or nurtured ones (followed or knew about you for months before buying). This helps you understand not just where your traffic comes from, but how warm it is.
Top Performing Ambassadors ranks your ambassadors by orders and revenue as reported through survey responses, including a Relationship tag showing how each ambassador is connected to your program.
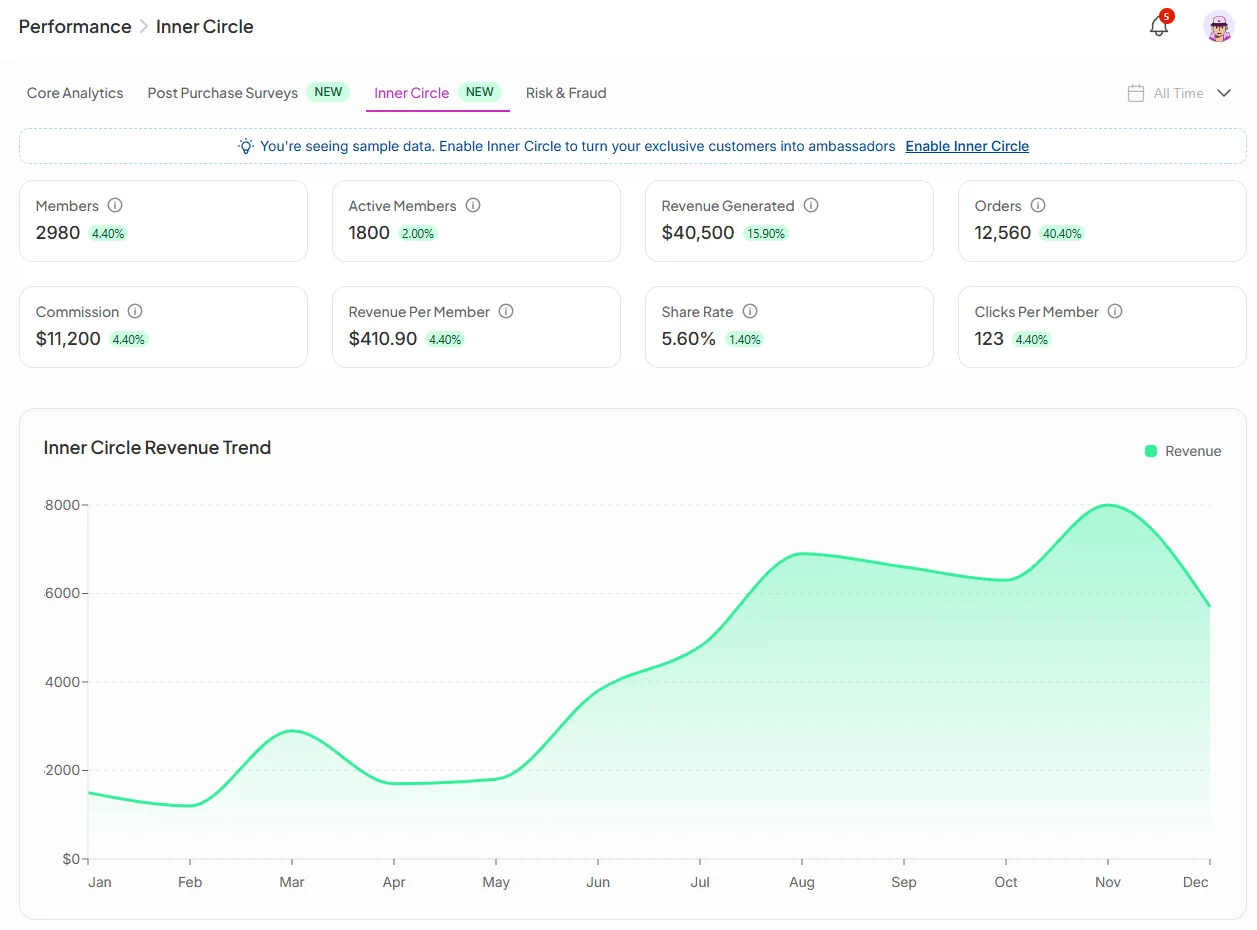
Inner Circle turns your existing customers into ambassadors automatically. When enabled, customers who make a purchase are invited to join your ambassador program right from the thank you page, with no outreach needed.
Key metrics:
Members: Total customers who have joined your Inner Circle
Active Members: Members who have driven at least one result
Revenue Generated: Total revenue attributed to Inner Circle members
Orders: Orders driven by Inner Circle members
Commission: Total commissions paid to Inner Circle members
Revenue Per Member: Average revenue each member is generating
Share Rate: Percentage of members who have shared their ambassador link
Clicks Per Member: Average clicks each member's link is generating
The Inner Circle Revenue Trend chart shows how revenue from this channel has grown over time.
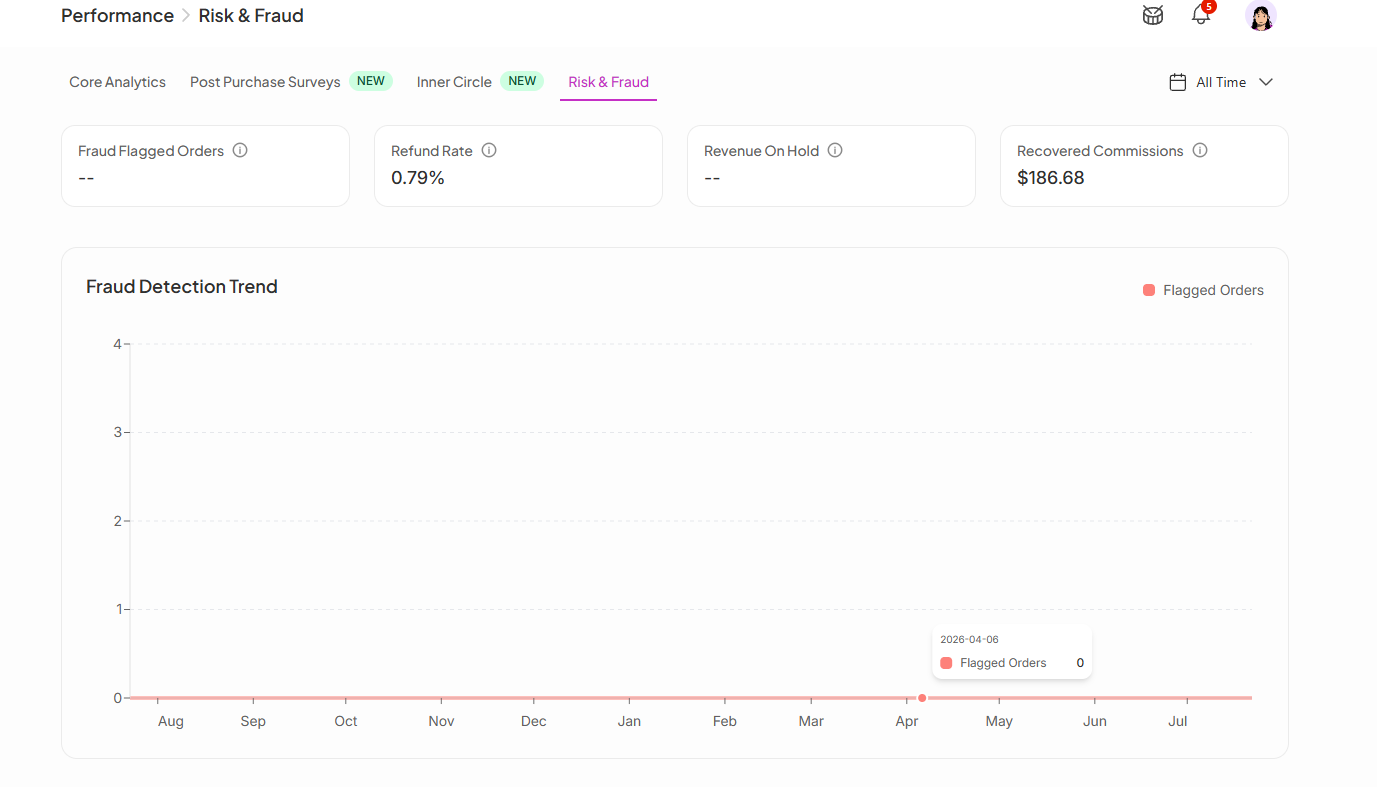
The Risk & Fraud tab gives you a real-time view of suspicious activity detected across your program, so you can act before it hits your margins.
Key metrics:
Fraud Flagged Orders: Orders SATHI has automatically flagged as potentially fraudulent
Refund Rate: Percentage of ambassador-attributed orders that were refunded
Revenue On Hold: Revenue being held pending fraud review
Recovered Commissions: Commissions clawed back after fraudulent orders were identified
The Fraud Detection Trend chart plots flagged orders over time, making it easy to spot unusual spikes and investigate what triggered them.
For a full breakdown of flagged orders and fraud management tools, head to the Fraud Center in the left sidebar.
Each of these three tabs answers a different question that Core Analytics alone can't: Post Purchase Surveys reveal attribution that tracking links miss, Inner Circle shows how much your existing customers are contributing as ambassadors, and Risk & Fraud flags where your program's margins are at risk. Together they give you the fuller picture needed to act on problems, like a fraud spike or an underused Inner Circle, before they compound.
Still need help?
Reach out anytime to our Support team using the button at the bottom-right corner of your dashboard, or email us at [email protected].

