Revenue Truth is the first tab you land on when you open Prism. It's the program-wide summary: total revenue, how much of it shifts once multi-touch attribution is applied, and how your ambassadors break down by role. This article walks through each section of the tab.
At the top of the tab, three figures sit side by side.
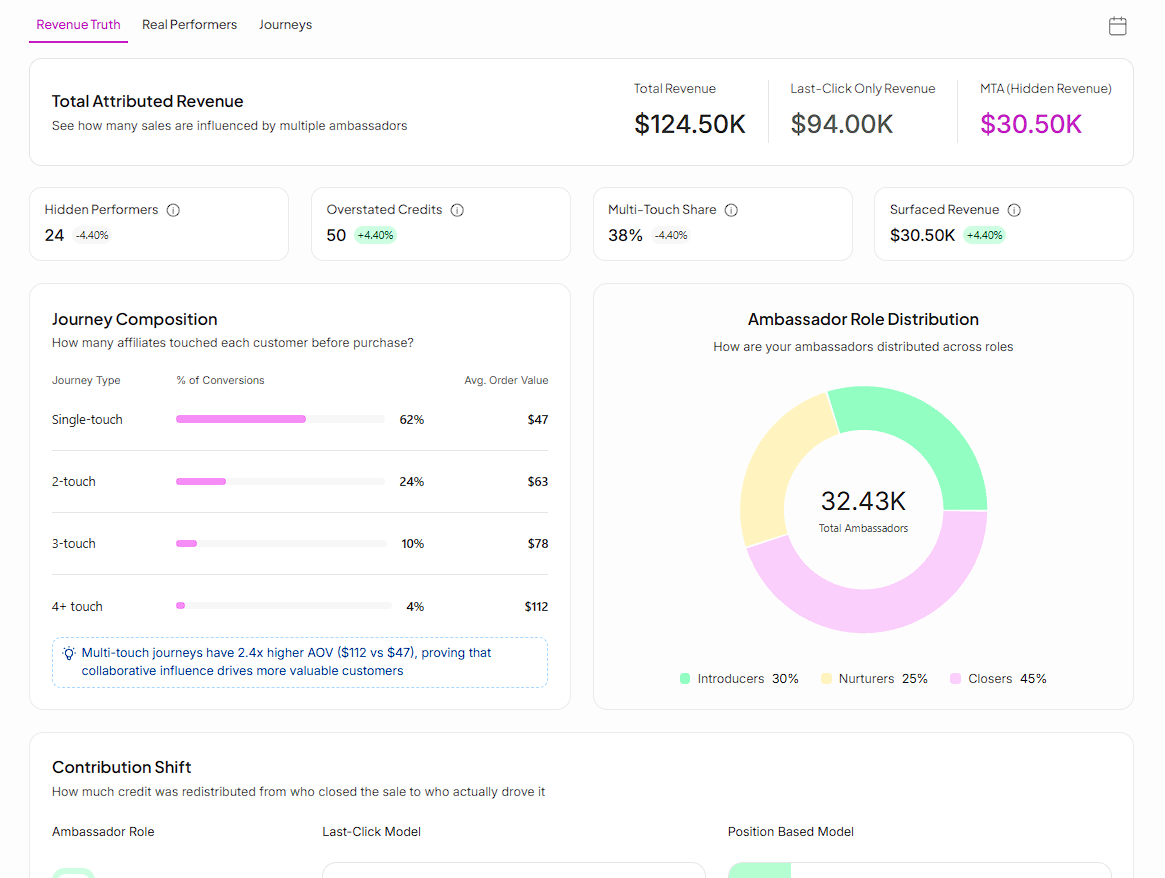
Total Revenue — total attributed revenue across your program. This number is the same under any attribution model; only how it's distributed changes.
Last-Click Only Revenue — revenue credited to whichever ambassador had the final touchpoint (click or code) in each journey.
MTA (Hidden Revenue) — the portion of revenue that shifts to earlier touchpoints once multi-touch attribution is applied. This is credit that last-click was hiding.
Below the headline numbers, four cards summarize the shift at a glance.
Hidden Performers — the number of ambassadors who earned $0 under last-click but have attributed revenue under multi-touch. These are ambassadors last-click was giving zero credit to.
Overstated Credits — the number of ambassadors whose attributed revenue drops once multi-touch is applied. These ambassadors were previously getting more credit than their actual influence supports.
Multi-Touch Share — the percentage of purchases that involved two or more ambassador touchpoints. The higher this is, the more your program relies on multiple ambassadors working together.
Surfaced Revenue — the dollar value of revenue that becomes visible to the right ambassador under multi-touch that last-click was assigning elsewhere.

This section breaks conversions down by how many ambassadors had touchpoints affecting the customer before they purchased.
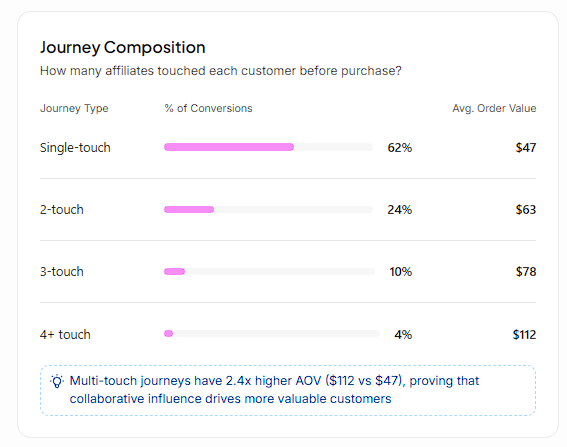
Each row shows the percentage of conversions at that touch count, along with the average order value. Multi-touch journeys consistently carry a higher average order value than single-touch journeys.

This donut chart shows how your ambassador community splits across the three roles: Introducer, Nurturer, and Closer.
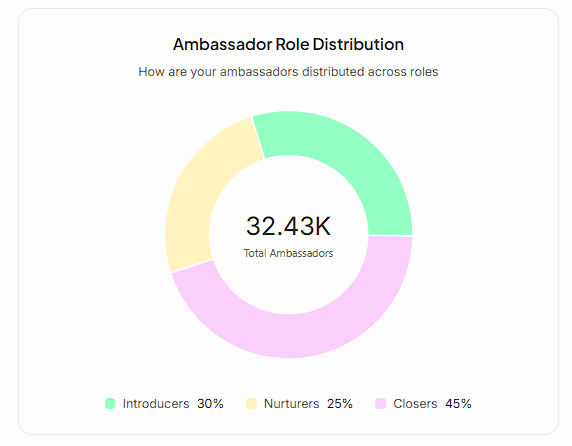
An ambassador's role here is based on whichever role they appear in most often across their journeys. An ambassador can be an Introducer in one journey and a Closer in another — this chart reflects their primary role.
This table shows, role by role, how credit moves between the last-click model and the position-based model.
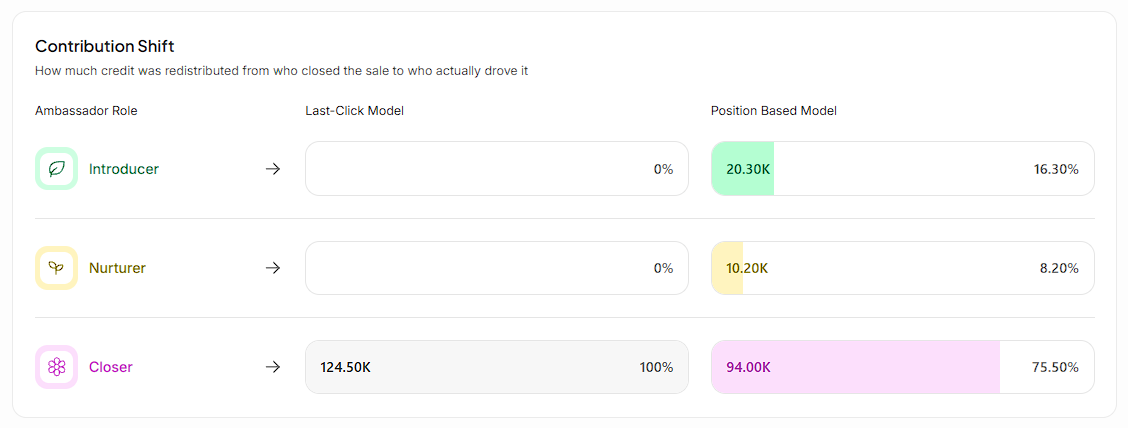
Under last-click, all credit sits with Closers — Introducers and Nurturers show 0%. Under the position-based model, credit spreads across all three roles according to their share (40% Introducer, 20% Nurturer, 40% Closer). This table is the clearest single view of how much credit last-click was concentrating in one place.
Still need help?
Reach out anytime to our Support team using the button at the bottom-right corner of your dashboard, or email us at [email protected].